
Statistical Analysis: To Hack Or Not To Hack-A-Shaq
IN MY 31 YEARS of coaching basketball I repeatedly heard the phrase “Never foul the jump shooter.” At first glance the statement seems reasonable. If a jump shooter with a 50-percent field-goal percentage takes 10 shots he or she would accumulate 10 points. If he or she is fouled in the act of shooting (with or without making the basket) and has a 60 percent free-throw percentage he would accumulate 12 points. So by letting him or shoot you would save at least two points.
However this maxim certainly doesn’t apply to situations in these past few years when players who are really poor foul shooter such as Shaquille O’Neal was shooting. Shaq is often intentionally fouled anytime he takes a shot and most often late in a close game. Opposing teams believe that it is better to foul a 60-percent field-goal shooter if he is a 50 percent free-throw shooter.
Being intrigued by this statistical dilemma and wondering if it actually had statistical merit I investigated this philosophy. With plenty of time on my hands (as I have since retired from coaching) and the statistical tools available (the “Fathom” software program from Key Curriculum Press) I simulated enough situations to produce data.Without getting too technical about the mathematical nuts and bolts of the experiment the following is a brief summary of steps taken to conduct the study.
STEP 1: I chose a sample of 20 shots and developed a spreadsheet type of chart.
STEP 2: In one column each shot was assigned a value of “2” or “0” as if the shooter was not fouled. The computer randomly assigned the value depending on the field-goal percentage selected.
STEP 3: In another column each shot was assigned a “2 1” or “0” as if the shooter was fouled and attempted free throws. The computer randomly assigned the value depending on the free-throw percentage selected. The sum for each column was then computed.
STEP 4: 1 000 collections of the above process were made for the selected field-goal percentage and paired with various free-throw percentages.
STEP 5: In each pairing the average points scored by allowing the shot were compared with the average points scored when shooting free throws.
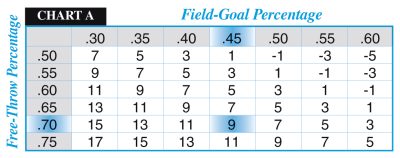
STEP 6: These two averages were subtracted. Each difference (rounded to the nearest whole number) is noted in the Chart A.
In analyzing the chart if you foul a player in the act of shooting and the player averages 45 percent from the floor and 70 percent from the free-throw line you are over 20 shots thus giving the opposing team 9 more points than you would if he or she were allowed to shoot. And remember that total would increase even more so if the shot attempt was made while he or she was fouled!
In O’Neal’s case however his 60-percent field-goal percentage combined with his 50-percent free-throw percentage gives him a difference of ñ5. So fouling him over 20 attempts actually favors the defense by 5 points.
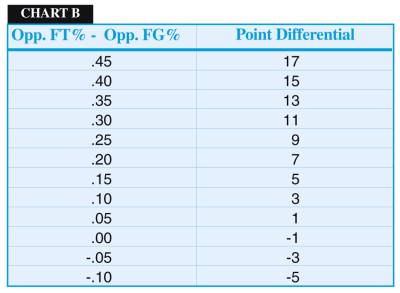
Based on the pattern in Chart A I compiled a simple table to calculate the point differential based on a player’s field-throw percentage minus his or her field-goal percentage (see Chart B).
As an example if a player on a team for an upcoming game has a 48-percent field-goal percentage (this is based on 2-point shot attempts) and a 73-percent free-throw percentage. The difference is 25 percent which yields a 9 point differential. This means that your team would be giving up at least 9 extra points if you fouled him or her in those 20 situations.
Obviously a game would probably not have 20 situations as described above. Many other conditions would certainly dictate your strategies such as amount of time left in game score etc. This statistical evidence however supports what all those wise old coaches have been preaching all these years. Now coaches have tangible evidence to back it up when they tell their players “Never foul the jump shooter!”

News
Videos


Shop