
More Ways Plus/Minus Ratings Can Help You Evaluate Players Lineups
EDITOR’s NOTE: The following article is a continuation of an article that ran in the January 2002 issue of Winning Hoops. For a detailed overview of how to calculate plus/minus ratings check out the January 2002 issue – available now!
PLUS/MINUS RATINGS are a simple statistical method of evaluating how a team is performing when a player or group of players is on the floor during a game.
I’ve been using plus/minus ratings as a member of George Karl’s staff for over 10 years dating back to our days of coaching in the Continental Basketball Association. It was introduced to us by Don Bassett a high school coach in Albany N.Y. and we’ve been using it ever since.At it’s simplest explanation if the Bucks substitute in Ray Allen and our team promptly goes on an 8-0 run and the other team is forced to call a momentum-stopping timeout then from the moment that Allen entered the game to the timeout he had a plus/minus rating of 8. (See the January 2002 Issue of Winning Hoops to learn how to calculate plus/minus ratings.)
At the professional level we can chart plus/minus ratings for just about every variable or situation that you can think of.
You can analyze plus/minus data by the game for the season by the minute over a certain stretch of games for home games away games vs. good teams poor teams and even evaluate the plus/minus ratings for entire groups of five to see which combinations play effectively together.
Analyzing Plus/Minus Data
Studying plus/minus data can help you piece together a good picture for how different aspects of your team are functioning for specific periods of time.
For example in 2001 our Milwaukee Bucks squad went to the NBA’s Eastern Conference finals and played the Philadelphia 76ers in a seven-game series. By analyzing the plus/minus data at several different angles some very distinctive observations can be made that may help influence some of your coaching decisions down the road.
By The Game
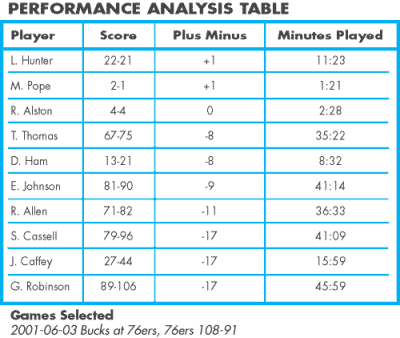
CHART A: Plus/Minus Performance Analysis Game 7 2001 Eastern Conference Finals. Here is a chart that details the individual plus/minus performances for Game 7 of Milwaukee’s Eastern Conference finals series vs. Philadelphia in which the Bucks lost 108-91.
Examining the plus/minus data for the game several interesting observations can be made:
– As a rule of thumb with plus/minus numbers your star players will generally have a plus/minus rating that mirror the team’s number as a whole. This is usually due to the fact that star players play a lot of minutes per game.
As an example this chart shows that Glenn Robinson’s plus/minus for this game was -17 in 46 minutes of playing time. You’ll notice that Robinson played almost the entire game (48 minutes in a game) and the team lost by 17 points. So in this case Robinson’s plus/minus number is more a reflection of the team’s score (The final game score was 108-91 and the scoring for the time that Robinson played was 106-89).
– When your team gets beaten by a solid margin your team as a whole will probably have very few players with a positive rating.
Chart A shows that in this game (a 17 point loss) only three out of the 10 players who played had a positive plus/minus rating and that two out of those three players logged fewer than 2 1/2 minutes of playing time.
– In this game we were missing our power forward Scott Williams from the lineup. It’s interesting to note that Williams happened to be one of the top rated plus/minus guys in the entire NBA in 2001. In the 2000-2001 NBA season there were only five or six players in the entire league who averaged double-digit plus ratings per 48 minutes a game for the season. Williams Portland’s Arvidas Sabonis three players from San Antonio and John Stockton who led the league. (On a side note players on poor teams have a hard time getting good plus numbers due to the fact that their teams are usually behind. In that case you’d want to look at the plus/minus ratings of those players or lineups within the context of their own team.)
We lost four games in the seven-game series and our worst loss came when Williams was out of the lineup (Game 7 108-91).
Series Stretch Of Games
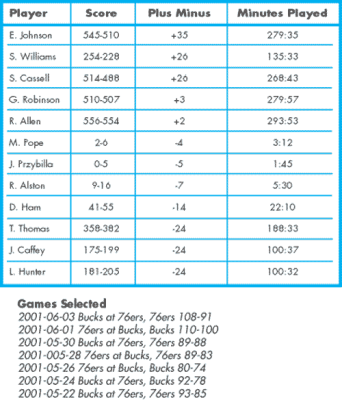
CHART B: Cumulative Plus/Minus Stats For Bucks 2001 Eastern Conference Finals Vs. Philadelphia (7 games). Studying the plus/minus data for a series of games or games over a certain span of time can yield some interesting observations about your team and how they were performing when certain individuals were on the floor.
This chart illustrates composite plus/minus totals for the entire Bucks/76ers seven-game series. The “Score” column indicates the amount of total points each team scored for the time that a particular player was on the floor.
If you look at Bucks center Ervin Johnson’s totals you can see that for the entire time he was on the floor in the series (279 minutes 35 seconds) that the Bucks outscored the 76ers 545-510 a plus/minus rating of 35.
Several observations can be made by looking at these comprehensive plus/minus numbers:
– Just as in the previous chart this chart really shows the importance of Scott Williams to our team last year and how well he played throughout the series. Even though Williams missed an entire game of the seven games in the series he still had the second-highest comprehensive plus/minus totals for the series.
Williams’ plus/minus totals for the series were 26. Sam Cassell our point guard also had a 26 but Cassell’s composite numbers came in 133 more minutes played. That’s a testimony to just how well our squad played when Williams was on the floor in that series.
– Probably the most important thing that this chart shows is just how much our bench struggled in the series. Each member of our starting five (Johnson Williams Cassell Robinson and Allen) had positive plus/minus ratings. The rest of the team (our bench) had negative plus/minus ratings.
The bench problem is magnified when you take into account that Mark Pope Joel Pryzbilla and Rafer Alston only played about 10 minutes combined. The other four bench players each had double-digit negative plus/minus numbers. This shows that during the stretches of the games that our bench players played substantial minutes our team struggled.
– Following the rule that players who play a lot of minutes have plus/minus ratings that mirror the plus/minus rating of the team holds true when you look at our team leader in minutes for the series Ray Allen.
This was a very competitive series. The majority of the games were tightly contested and very close. If you throw out each teams biggest win margin (Philly by 17 in Game 7 and Milwaukee by 14 in Game 2) the average margin of victory in the remaining 5 games was 5 points. Allen who averaged 42 minutes a game (294 total minutes played) had a composite plus/minus rating of 2 (Or close to zero). This is very reflective of the tight nature of each game.
Plus/Minus For Lineup Analysis
There are times during the course of a season where a coach will observe that it seemed like a particular group of players that he or she had on the floor worked well together and seemed like a good lineup. You can utilize plus/minus ratings to validate your observations.
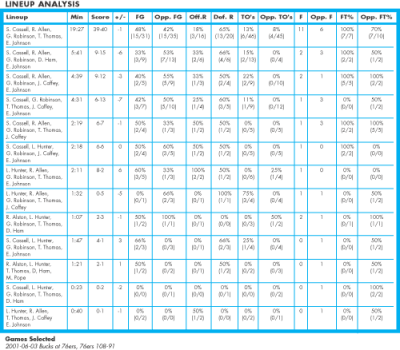
CHART C: Plus/Minus Lineup Evaluation For Bucks 2001 Eastern Conference Finals Vs. Philadelphia Game 7. (Bucks at 76ers 76ers Win 108-91) Combining plus/minus ratings with statistical information compiled from the box score can give you a good breakdown of how different lineup combinations are playing for the minutes that they were out on the floor together.
Use Stats As An Aid
Use the plus/minus statistical formula as just another one of many tools available to you that will help you evaluate your team. If one of your better players has a poor plus/minus rating for a period of time does that mean that your aren’t going play him any more? Of course not. But perhaps statistical analysis of various kinds can help you try to figure out why something is happening and how you and the rest of the coaches on your staff can go about making adjustments from a coaching standpoint that will have a positive effect on your team.
A nice aspect of tracking plus/minus statistics is that the players on your team will be aware that the coach is grading the team’s performance for every second that he or she is on the floor. So not only are you holding that player accountable for his or her performance but you are doing so while stressing the context of team play.
It also gives role players or players who aren’t necessarily big scorers or into compiling big personal statistics another way to evaluate and feel good about what he or she is doing out on the court.
Easy To Adapt Track
Keeping track of plus/minus statistics is a relatively simple way for you and your coaching staff to gain data on individual players and different lineups. Plus/minus stats for individual games are very easy to calculate and can be done by hand.
The person who’s tracking plus/minus needs to be paying close attention to the substitutions at every stoppage of play but it’s not the kind of stat-keeping device that calls for the undivided attention of the person who’s keeping track of it as is the case with something like a shot chart.
For the more detailed plus/minus statistics you’ll need nothing more than a simple spreadsheet program or one of the many scouting software programs that are currently available.

News
Videos


Shop